See your unified memory. Own your edge.
Real-time visualization of Jetson's unified memory pool. CPU allocation, GPU allocation, per-process breakdown, thermal correlation.
What It Shows
-
256MB Cell Memory Heatmap
Visual grid of unified memory divided into 256MB cells. Color-coded by utilization intensity.
-
CPU vs GPU Allocation Split
Real-time breakdown of how unified memory is partitioned between CPU and GPU workloads.
-
Top Process Memory Consumers
Ranked list of processes by memory consumption with live updates.
-
12-Core CPU Utilization Grid
Per-core utilization visualization across all 12 ARM Cortex-A78AE cores.
-
Thermal Zones with Color Coding
Temperature readings across CPU, GPU, and SoC thermal zones with threshold alerts.
-
Power Rail Breakdown
Real-time power consumption per rail — SoC, CPU, GPU, and total system draw.
-
5-Minute Timeline Chart
Rolling 5-minute history of memory utilization, thermal state, and power draw for trend analysis.
Live Dashboard
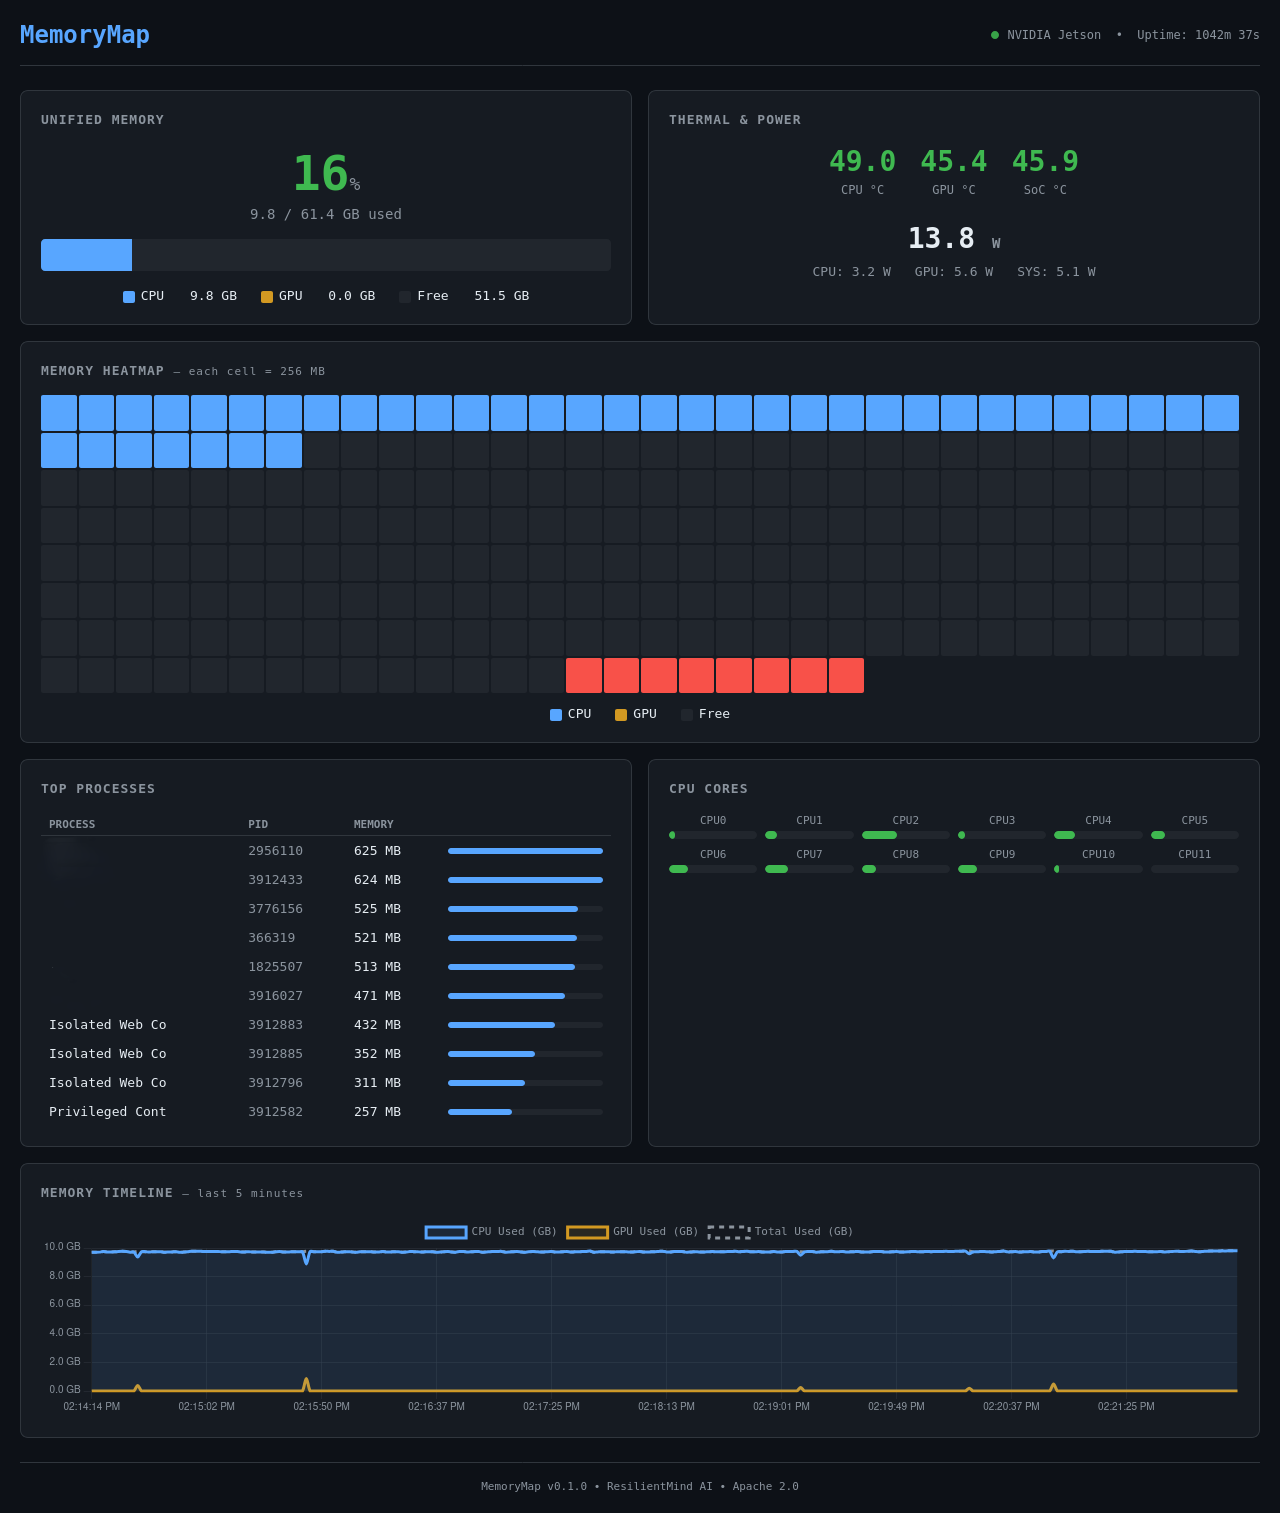
Live dashboard — NVIDIA Jetson AGX Orin 64GB, 16% unified memory utilized
Platform Integration
MemoryMap runs alongside every other CommandRoomAI module, providing continuous visibility into unified memory allocation during inference, training, compression, and security operations.